Cross-source analysis
Aggregates Sentinel reports, Sleuth Net activity, and partner records into one analytical view, so trends that are invisible inside any single source become measurable.
Analysis for the people who have to decide.
The Dashboard turns the network’s accumulated reporting into patterns, briefings, and evidence. It is built for the agency analyst, the program director, and the grant report that has to be defensible.
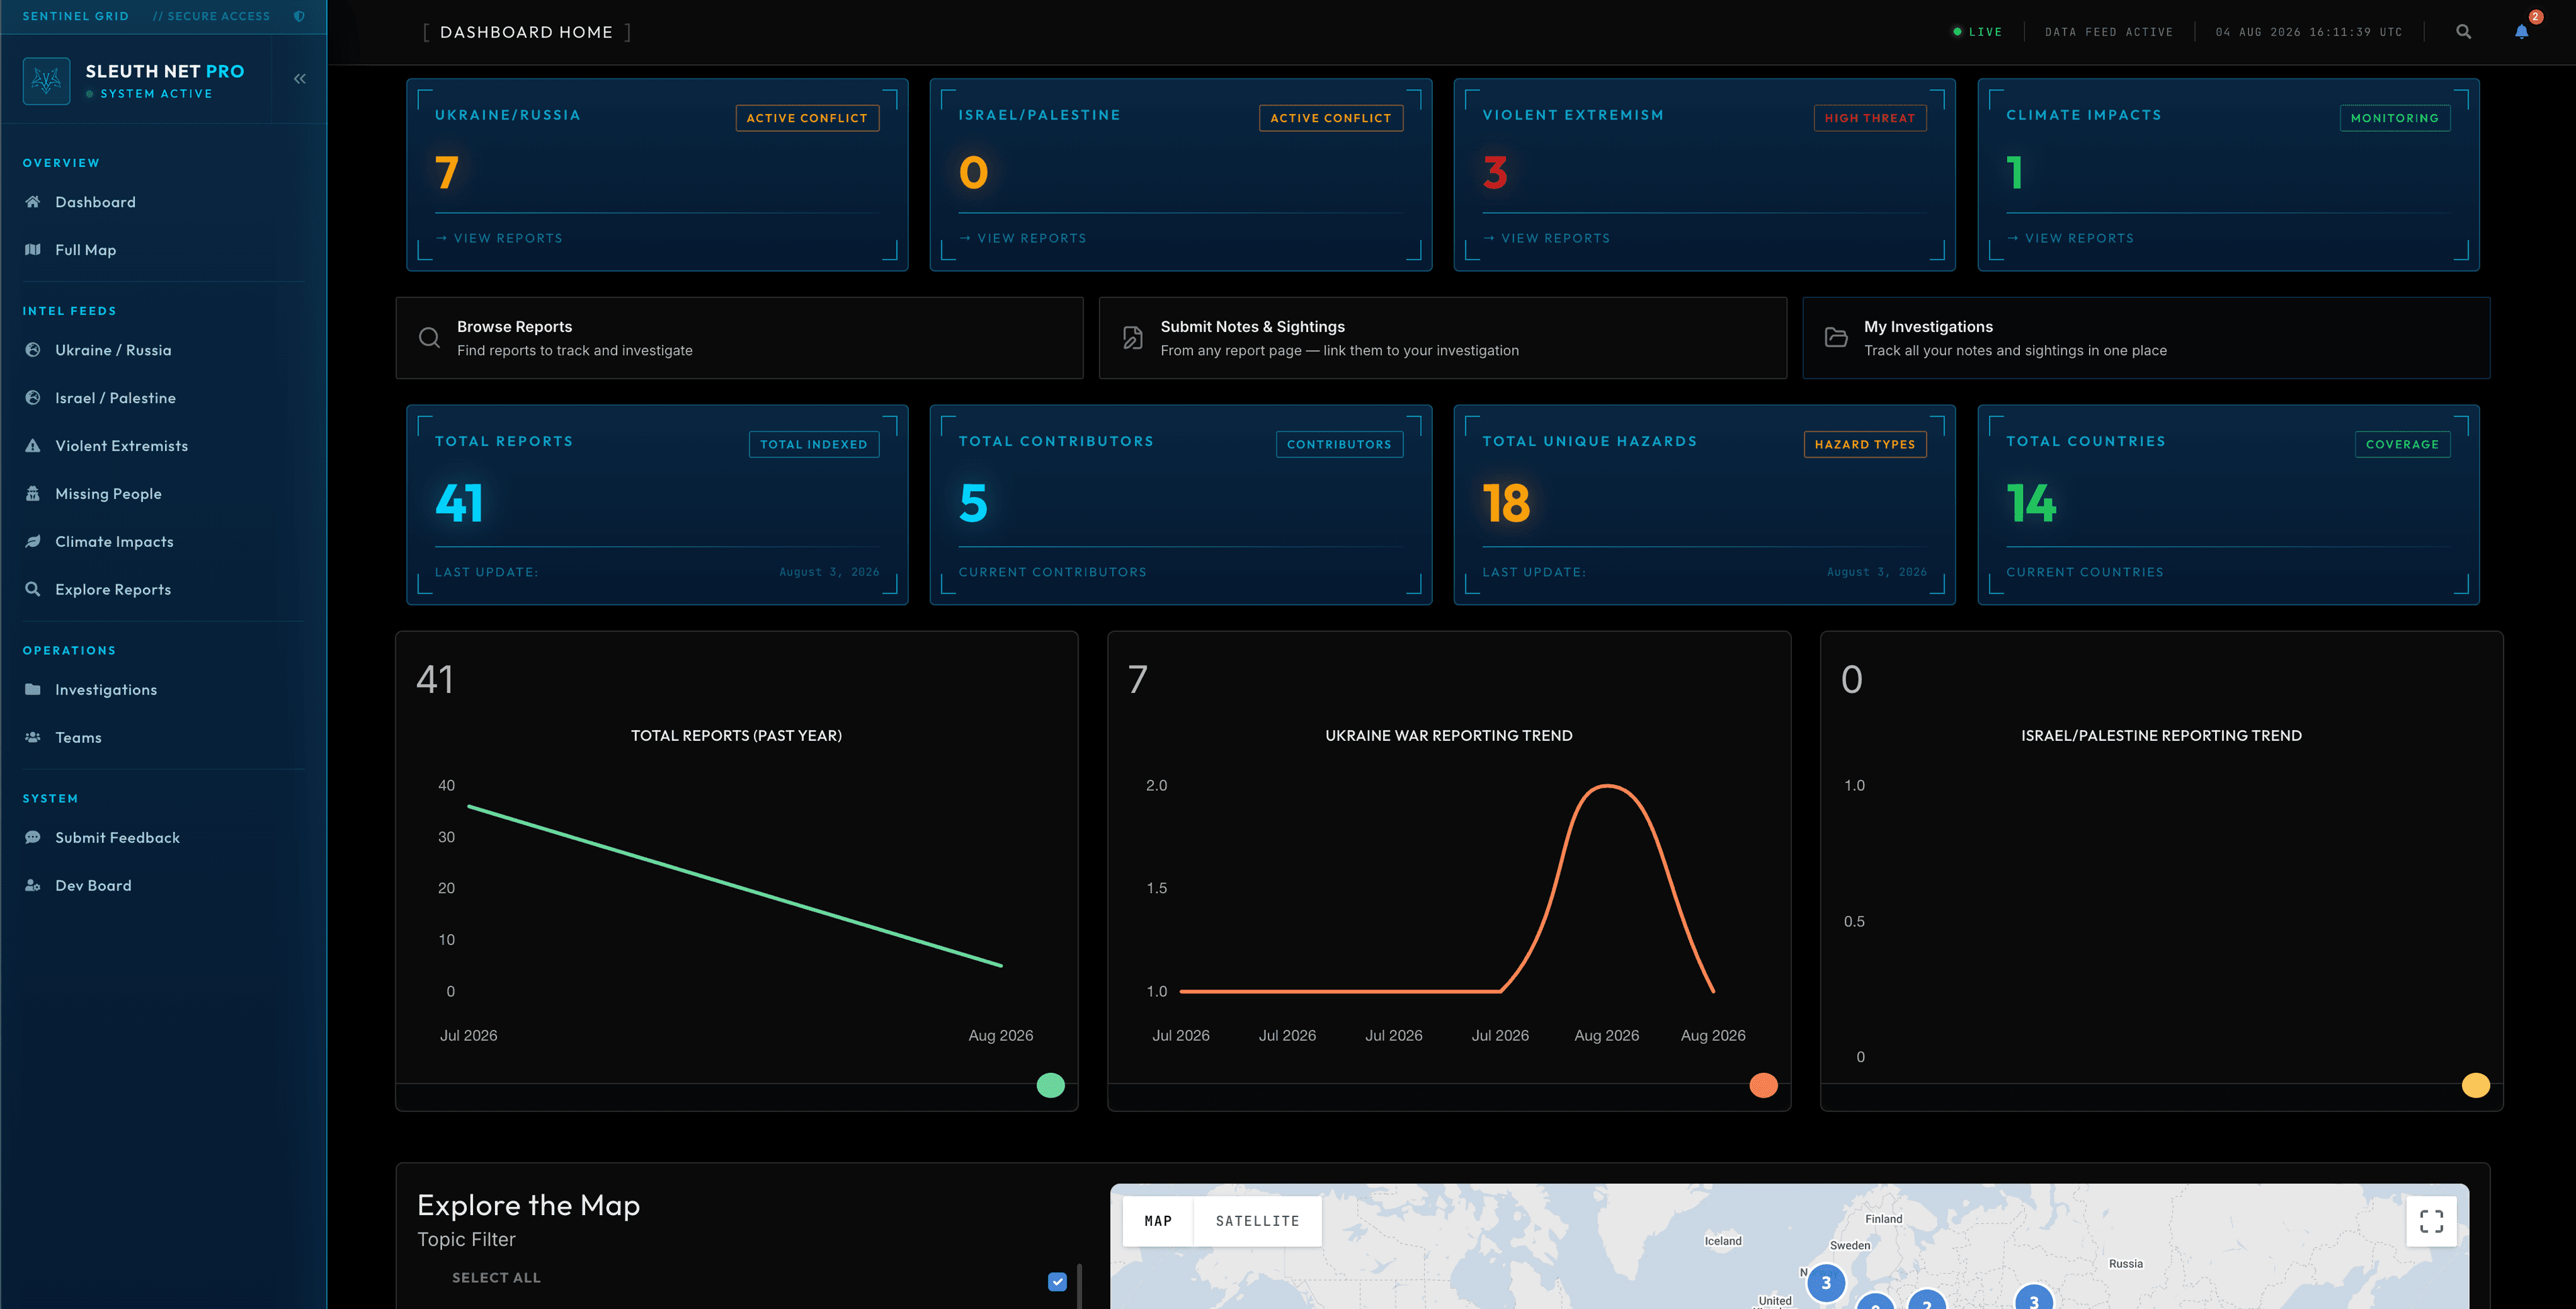
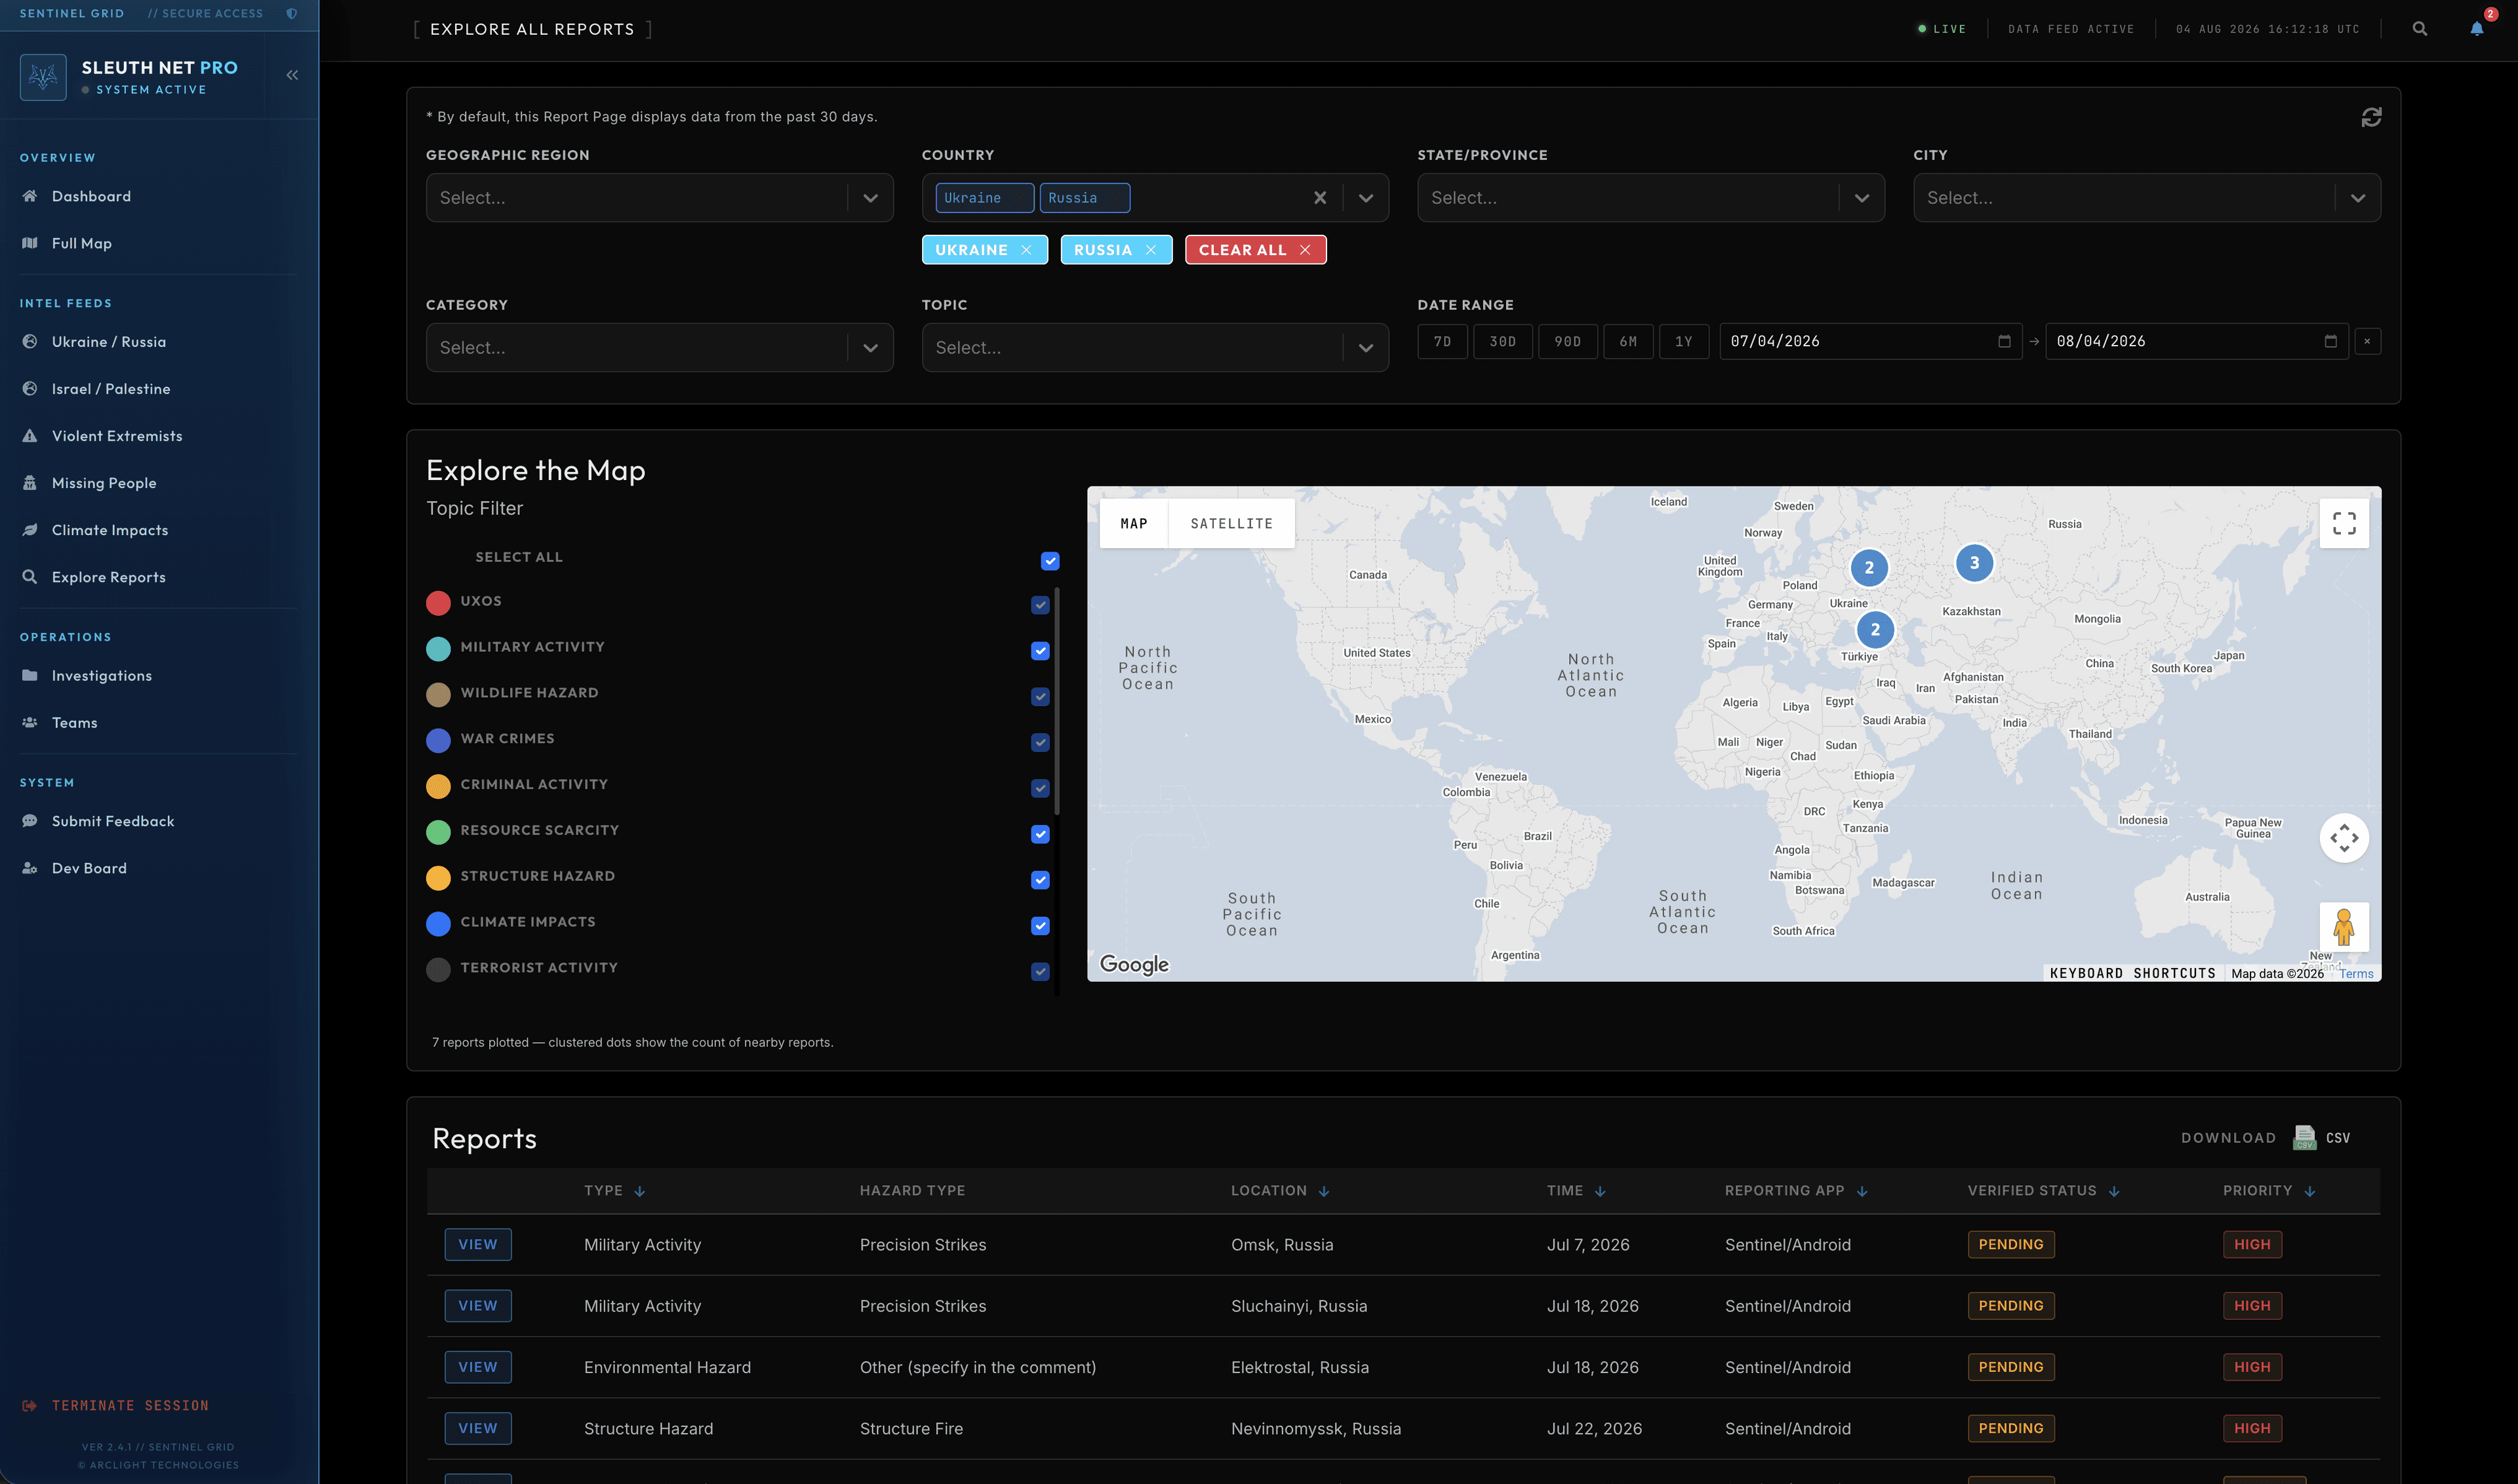
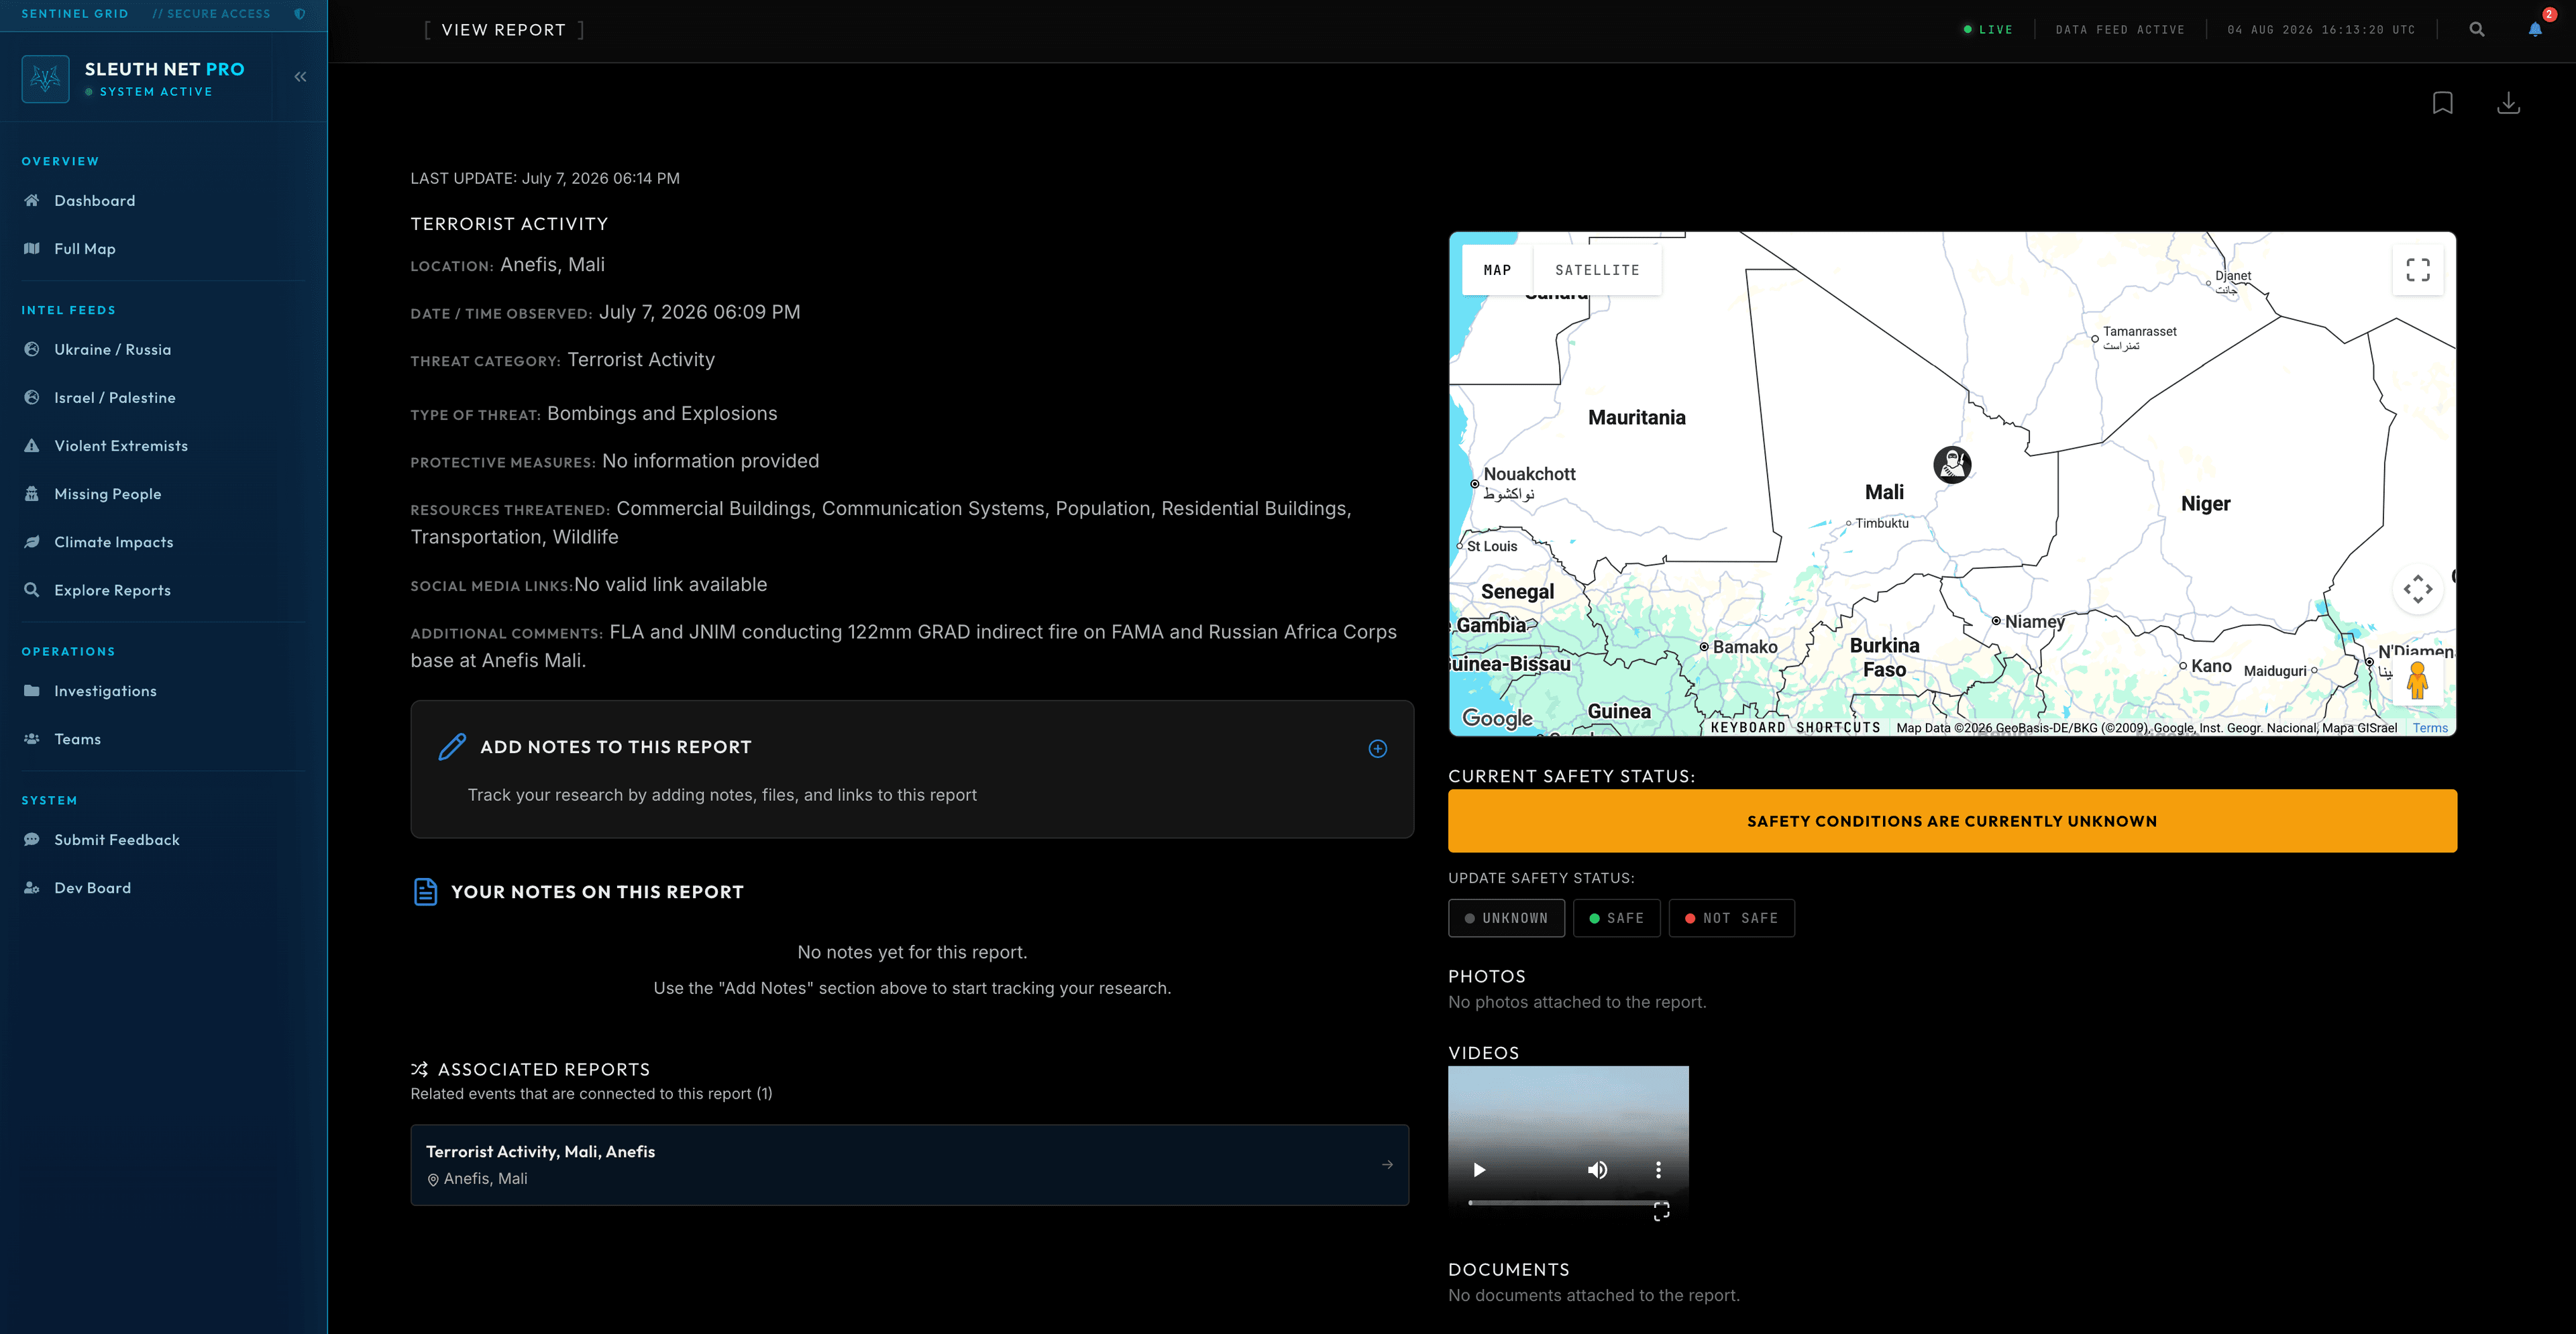
Aggregates Sentinel reports, Sleuth Net activity, and partner records into one analytical view, so trends that are invisible inside any single source become measurable.
Incident data is examined across time and geography to surface concentrations and emerging trends rather than leaving an analyst to eyeball a map.
Views can be scoped to the boundaries an organization is actually responsible for, which is what makes the output usable in an oversight or funding conversation.
PDF and CSV export for briefings, board packets, grant reporting, and interagency distribution — the formats that decisions actually travel in.
Enough of the architecture to judge whether we know what we are doing — not enough to hand someone a blueprint.
Reporting data is consolidated from across the platform on a scheduled basis, keeping analytical queries off the transactional systems the live products depend on.
Aggregates are computed over time and geographic dimensions so the interface can stay responsive at reporting scale rather than recomputing on every page load.
Results render as visual summaries built for interpretation by non-specialists — the people signing off on a program are rarely the people who built the query.
Any view can be committed to PDF or CSV, preserving the filters applied so a figure in a report can always be traced back to the query that produced it.